Locations in the Vostitsa Landscape
Companion for THDD episode 2.13
The locations where people choose to settle can tell us about their priorities and concerns. One concern was for safety from threats from the coast, which led to settlements in remote, difficult to travel to areas. Continuation or abandonment of settlements from one time period to another -- although the records for this project with at least 200 years between them might mask abandonment and resettlement between records -- may also indicate which locations were well-situated.
Maps showing the locations by time period along with the locations of 50 random places for comparison.
1. 1463 Locations
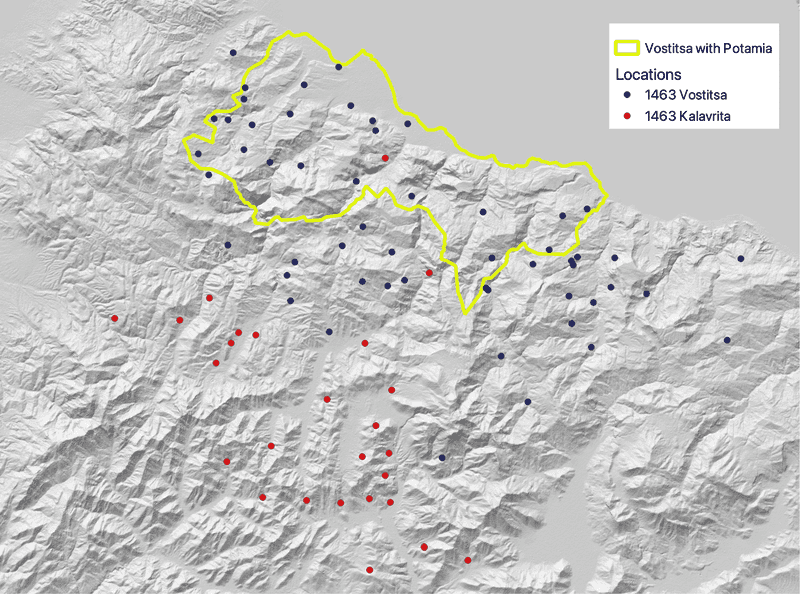
In 1463 the Ottoman records do not have strict boundaries, which is why 1 location from Kalavryta is within the 1700 Vostitsa borders. Of the 55 known Vostitsa locations, only 23 were within the 1700 border, plus 1 Kalavryta location makes 24 locations for analysis.
2. 1700 Locations
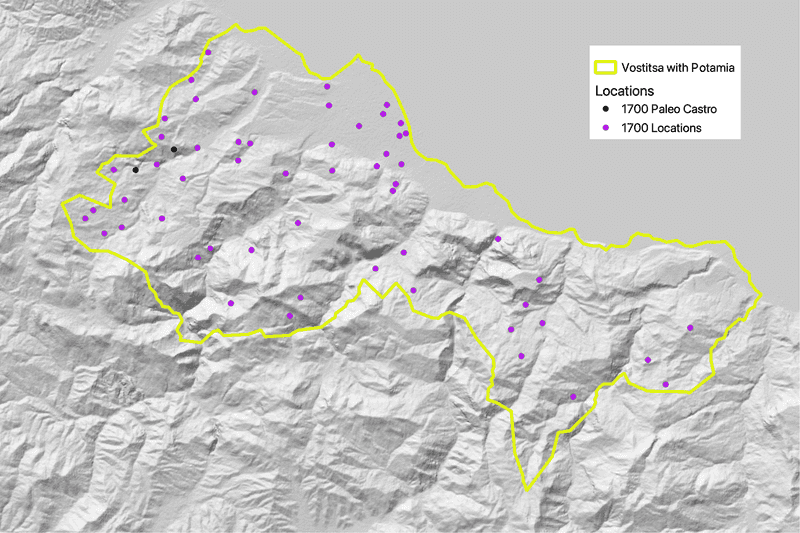
Unsurprisingly, all of the 1700 Vostitsa locations are within the 1700 borders. However, 2 of the locations are labeled Paleo Castro -- old castle -- indicating that they are former settlements. One Paleo Castro matches a 1463 settlement, while the other does not. Excluding the Paleo Castro locations, there are 55 locations for analysis.
3. 1907 Locations
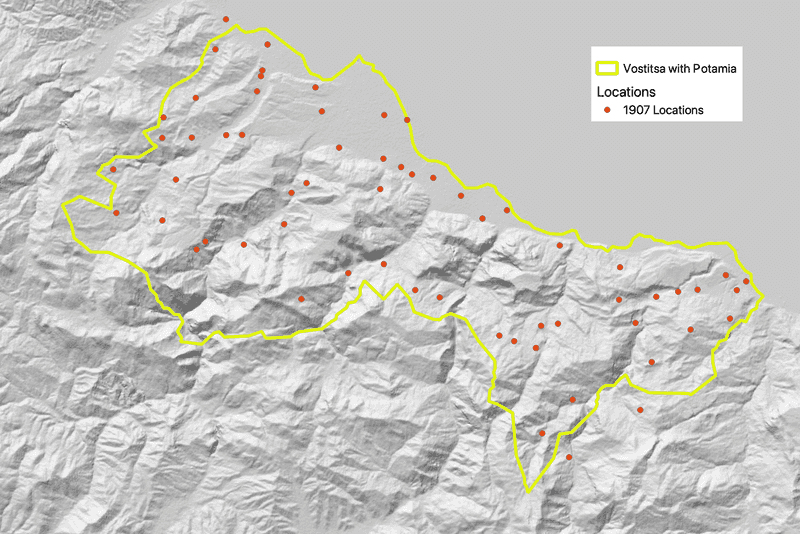
The 1907 locations belong to smaller units that do not completely intersect with the 1700 border, so only 59 out of 63 locations in the dataset are used in the analysis.
4. Random Locations
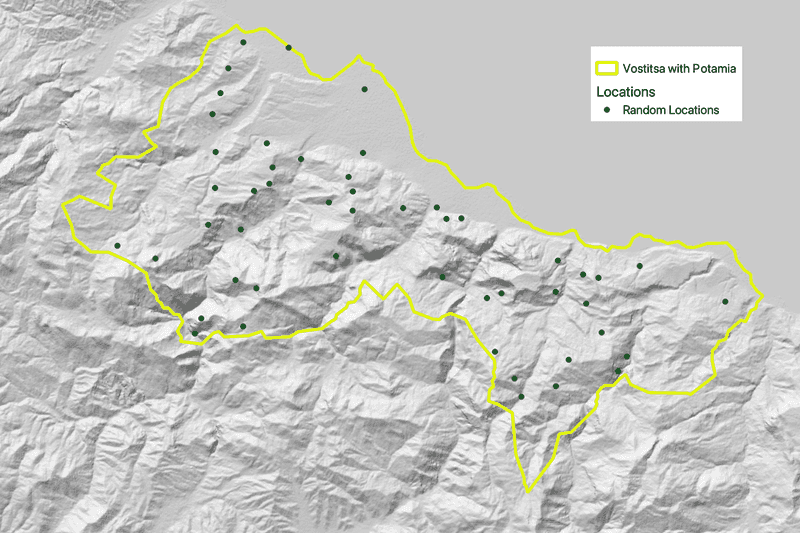
50 random locations were selected that do not overlap the locations from any of the three time periods. When appropriate, the random locations are included in the plots below to give a sense of what places outside of the settled locations were like.
Plots, building off the analysis of the Vostitsa landscape, about settlements in the landscape:
5. Elevation by period within 1 km of location
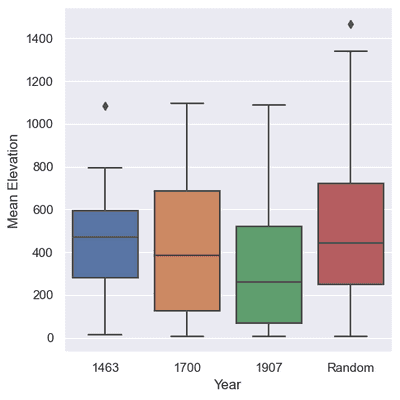
The random group are 50 random points that do not intersect locations from any time period to get a sense of locations that were not settled during the three time periods. In this plot, note that although the range of values for each time period is roughly the same, the median elevation -- the interior line in the boxes -- decreases through time. This may mean that less remote locations at lower elevations became preferred during the later time periods.
6. Ruggedness by time period within 1 km of location
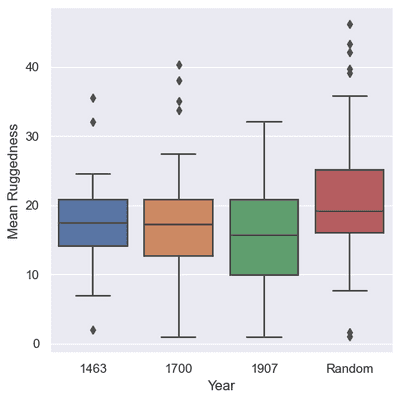
Ruggedness shows whether the terrain is jagged with a lot of up and down, or smooth, with more constant elevation. By time period, ruggedness decreases slightly, with the random locations in more rugged locations overall.
7. Landform by time period

The type of landform that makes up the majority of area 1km around a location provides additional information about the terrain where settlements were located. The original dataset of landforms has been simplified to slopes, streams, valleys, plains, and ridges. Through time, more locations were on slopes, valleys, plains, and ridges, and less on streams. Keep in mind that the number of locations also increases by time period.
8. Neighboring settlements within 3 km by time period
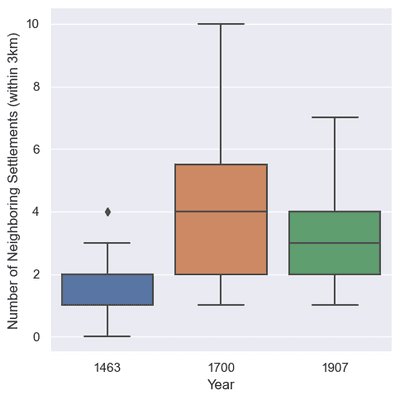
Following Seifried 2015 to analyze physical connectedness of each location by looking at how many places were within 3 km of each location. For Vostitsa, there is not much difference in the mean number by time period, although the mean is lowest in 1463, highest in 1700, and slightly less in 1907.
9. Distance to the coast
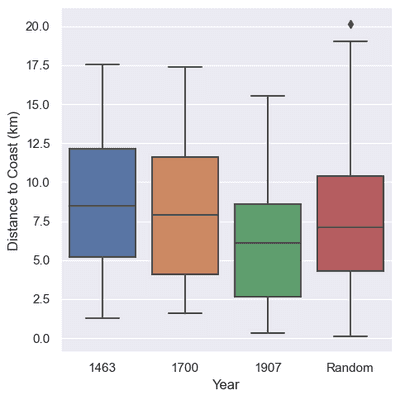
Mean distance to the coast decreased a little between 1463 and 1700, but was least in 1907 indicating that more settlements could be found near the coast at that later period. This probably shows greater confidence that threats would not be coming from the coast -- fewer pirate threats.